
Content navigation
Market and Performance Overview
Emerging markets returned 4.2% during the month as measured by the MSCI Emerging Markets Index. South Korea was the standout performer with its information technology (IT) sector up 35% in October while industrials rose 21% as both sectors are benefiting from accelerating AI-related demand. Taiwan also outperformed the broad market thanks to ongoing strength among its largest IT companies. Notably, India finished roughly in line with the index in October, reversing a period of year-to-date weakness. Meanwhile China, the largest country weighting in the benchmark, rolled back recent strong gains due to a combination of profit-taking, weakness in health care and a tepid response to the first Trump-Xi meeting in six years.
Within the benchmark, companies in the IT, industrials and energy sectors were the strongest performers as they continued to see broad-based AI tailwinds. Meanwhile, communication services, consumer discretionary, health care and consumer staples companies were laggards for the month.
The ClearBridge Emerging Markets Strategy outperformed its MSCI Emerging Markets Index benchmark in October, supported by strong stock selection in South Korea, Taiwan and South Africa and an underweight to China. From a sector standpoint, stock selection and an overweight to the IT were the primary drivers of relative outperformance, offsetting negative stock selection in the communication services sector.
Individual holdings that performed well during the month included SK Hynix, Samsung Electronics, Hyundai Electric, Taiwan Semiconductor and Sieyuan Electric.
South Korea-based SK Hynix and Samsung were boosted by results from U.S. semiconductor and data center companies, suggesting that the AI infrastructure story continues with vigor, as well as strong DRAM prices. Momentum in Taiwan Semiconductor shares was extended by very strong quarterly results with margins coming in above expectations and positive management commentary around AI demand. Additionally, South Korea’s Hyundai Electric and China’s Sieyuan Electric both delivered robust results tied to AI-related power demand, with Hyundai seeing a reacceleration in new order growth.
Detractors in the period were Tencent, Shenzhen Inovance, CATL, MakeMyTrip and Trip.com
Chinese companies Tencent and CATL were pressured by profit taking after strong recent stock performance, while Inovance saw decent quarterly results from its core industrial automation business but sold off on weaker than expected margins in its auto business. Indian online travel agent MakeMyTrip delivered strong quarterly revenue and earnings gains but was hurt by air travel capacity constraints and a generally weak Indian consumer. Chinese online travel agency Trip.com suffered from similarly subdued consumer demand in its market.
-
"China will continue to play a key role, and we believe its recovery has only just begun."
Portfolio Positioning
During the period, there were no new additions or sales of existing holdings.
Outlook
As we progress toward 2026, we think the key drivers of EM returns, and thus the biggest opportunities, will be in technology, and, on a regional level, in India and China. Technology companies in EM are core to the global adoption of AI, and the longer-term structural growth opportunity of EM technology is broader than in developed markets. This should place EM well to succeed in the next 12 months and beyond. With its high-quality, sustainable growth companies, India, though weak so far this year, should return to the strength it saw in 2024 as the market returns to recognizing fundamentals in share prices. Finally, as the largest country in the asset class, China will continue to play a key role, and we believe its recovery has only just begun.
Exhibit 1: China - Valuation Opportunity Remains Compelling
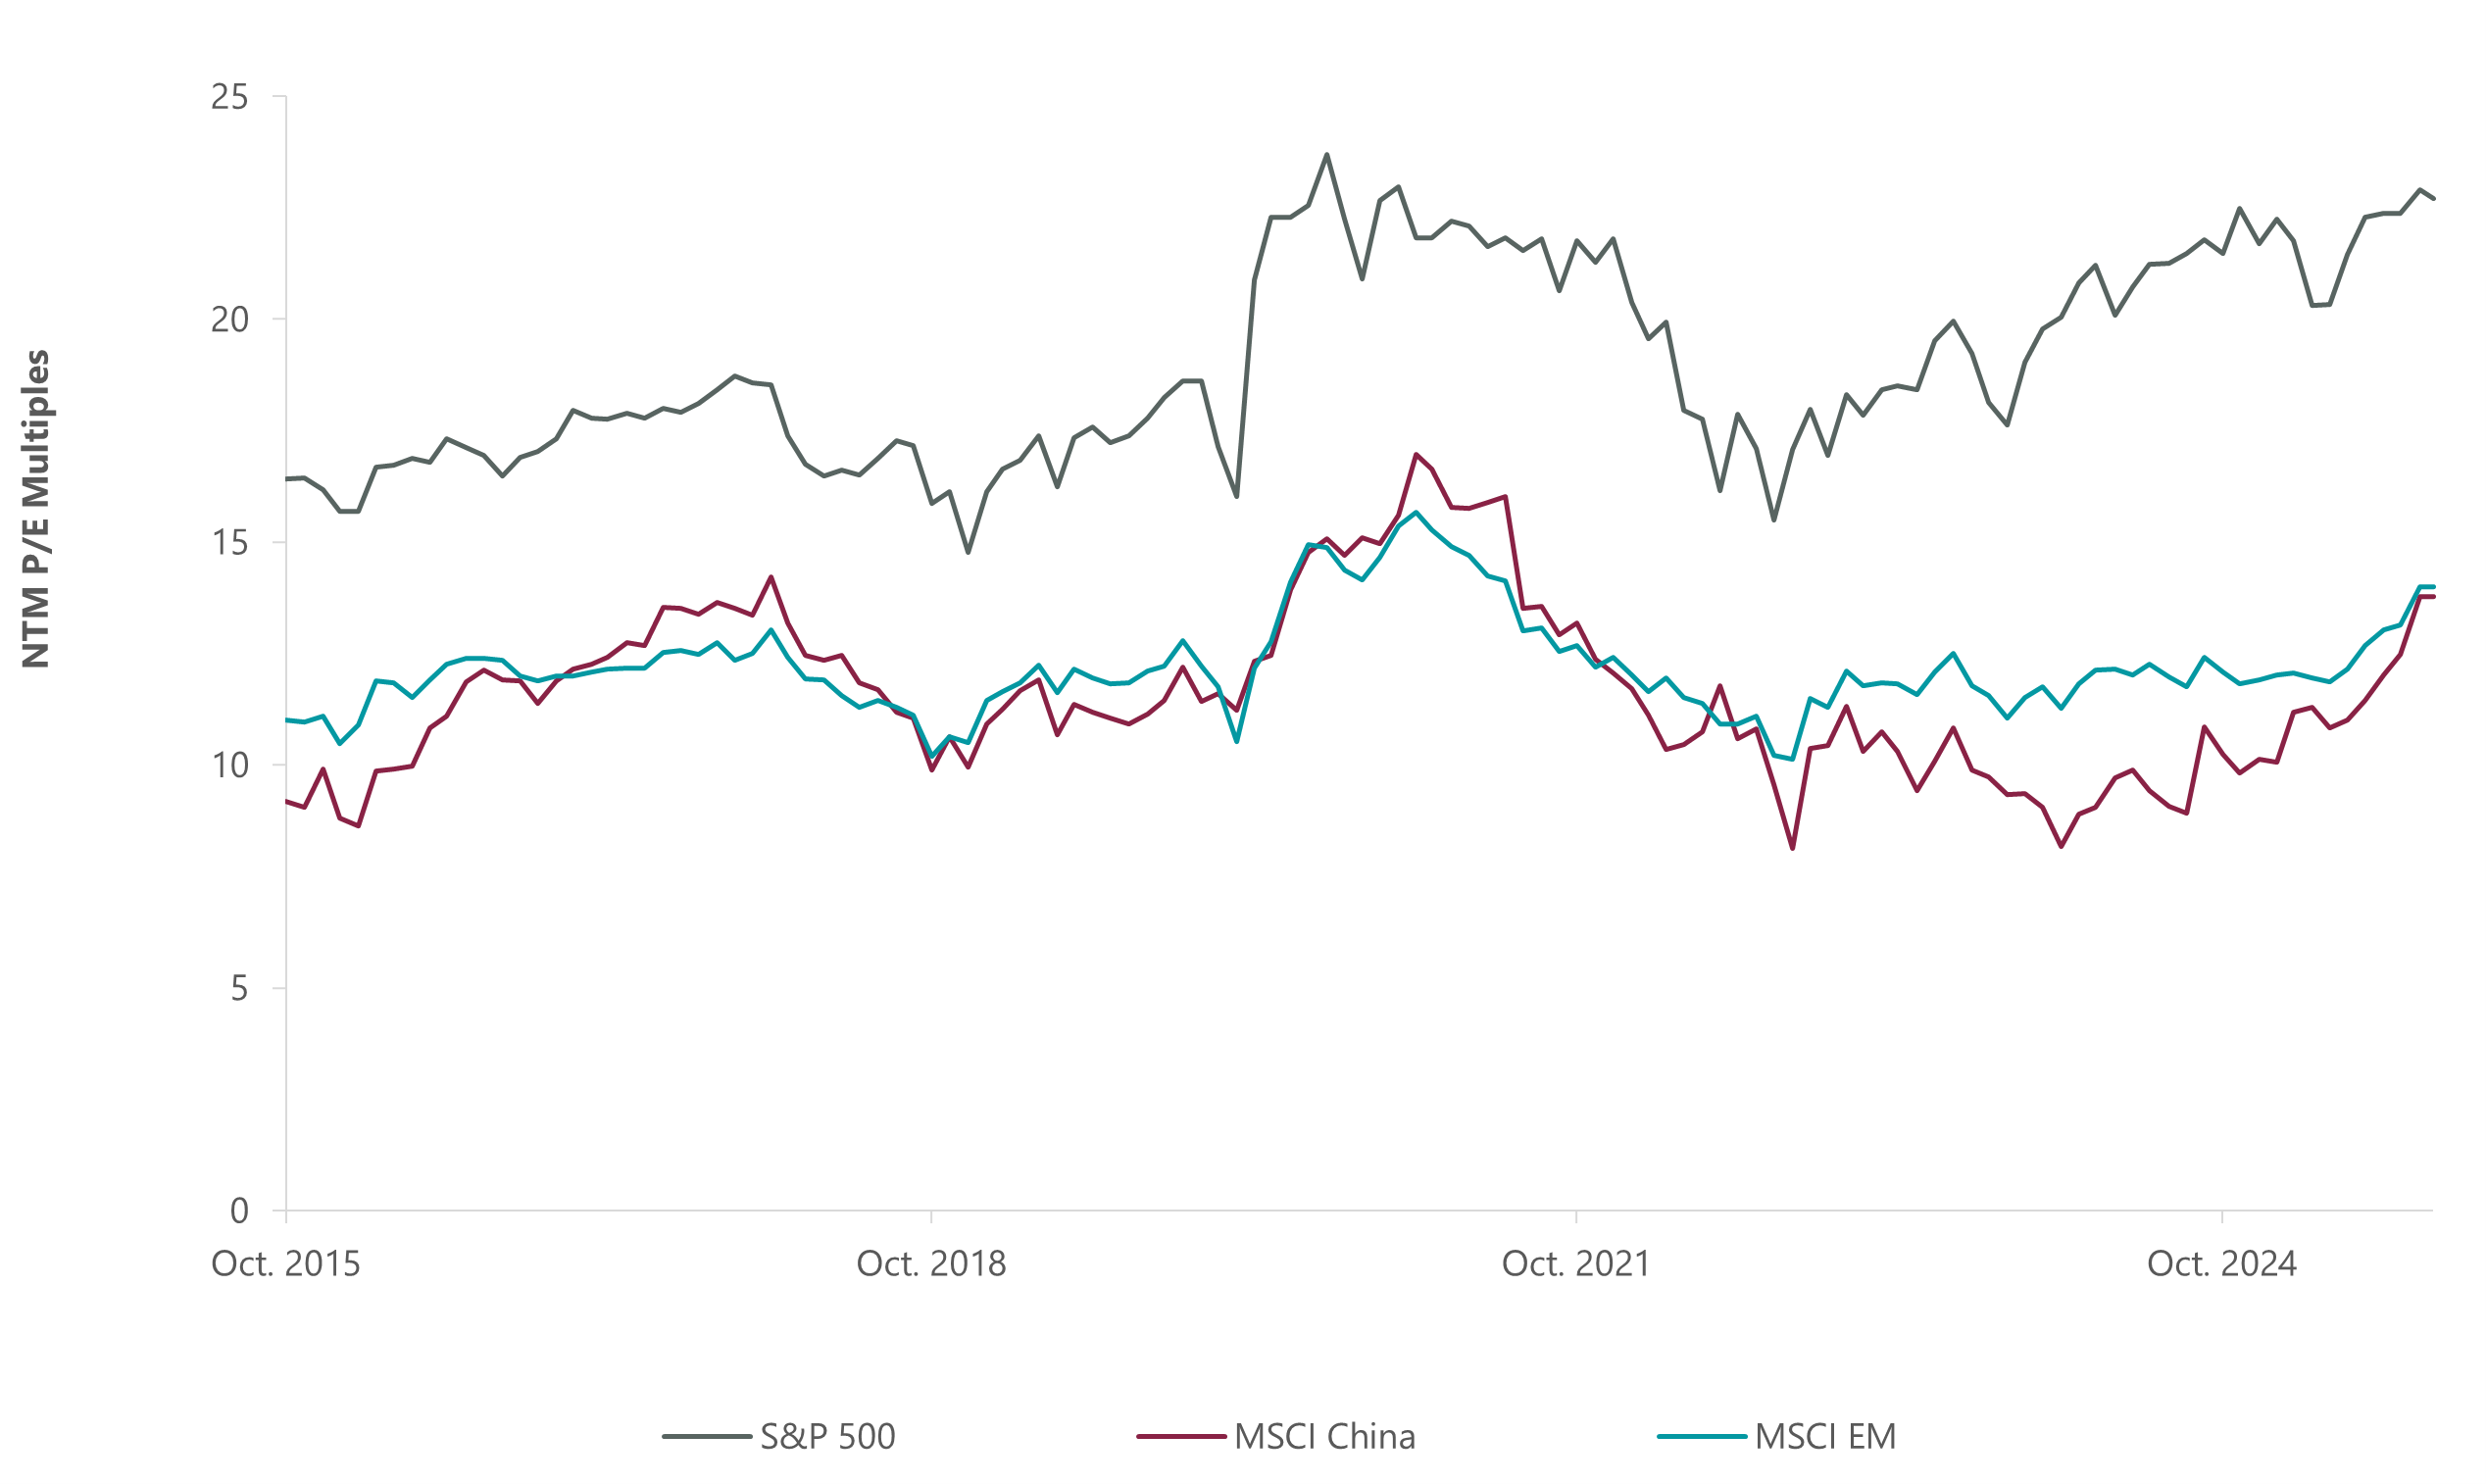
Source: FactSet. Data as of Oct. 6, 2025.
Equity performance improvements in EM year to date have been more company specific than broad based. Investor flows into the asset class have not picked up significantly, which we believe represents a potential coiled spring. Emerging markets continue to trade at a valuation discount to developed markets. Should investors begin to feel that they are missing out on attractive EM returns, positive flows could become a tailwind.
The information provided should not be considered a recommendation to purchase or sell any particular strategy / fund / security. It should not be assumed that any of the security transactions discussed here were or will prove to be profitable.
Important Information
This information is issued and approved by ClearBridge Investment Management Limited (‘CIML’), authorised and regulated by the Financial Conduct Authority. It does not constitute investment advice. Market and currency movements may cause the capital value of shares, and the income from them, to fall as well as rise and you may get back less than you invested.
The information contained in this document has been compiled with considerable care to ensure its accuracy. However, no representation or warranty, express or implied, is made to its accuracy or completeness. ClearBridge Investments has procured any research or analysis contained in this document for its own use. It is provided to you only incidentally and any opinions expressed are subject to change without notice.
This document may not be distributed to third parties. It is confidential and intended only for the recipient. The recipient may not photocopy, transmit or otherwise share this [document], or any part of it, with any other person without the express written permission of ClearBridge Investment Management Limited.
This document is intended only for a wholesale, institutional or otherwise professional audience. ClearBridge Investment Management Limited does not intend for this document to be issued to any other audience and it should not be made available to any person who does not meet this criteria. ClearBridge Investments accepts no responsibility for dissemination of this document to a person who does not fit this criteria.
The document does not form the basis of, nor should it be relied upon in connection with, any subsequent contract or agreement. It does not constitute, and may not be used for the purpose of, an offer or invitation to subscribe for or otherwise acquire shares in any of the products mentioned.
Past performance is not a guide to future returns.
The distribution of specific products is restricted in certain jurisdictions, investors should be aware of these restrictions before requesting further specific information.
The views expressed are opinions of the portfolio managers as of the date of this document and are subject to change based on market and other conditions and may differ from other portfolio managers or of the firm as a whole. These opinions are not intended to be a forecast of future events, research, a guarantee of future results or investment advice.
Some of the information provided in this document has been compiled using data from a representative account. This account has been chosen on the basis it is an existing account managed by ClearBridge Investments, within the strategy referred to in this document. Representative accounts for each strategy have been chosen on the basis that they are the longest running account for the strategy. This data has been provided as an illustration only, the figures should not be relied upon as an indication of future performance. The data provided for this account may be different to other accounts following the same strategy. The information should not be considered as comprehensive and additional information and disclosure should be sought.
The information provided should not be considered a recommendation to purchase or sell any particular strategy / fund / security. It should not be assumed that any of the security transactions discussed here were or will prove to be profitable.
It is not known whether the stocks mentioned will feature in any future portfolios managed by ClearBridge Investments. Any stock examples will represent a small part of a portfolio and are used purely to demonstrate our investment style.
Risk warnings – Investors should also be aware of the following risk factors which may be applicable to the strategy shown in this document.
- Investing in foreign markets introduces a risk where adverse movements in currency exchange rates could result in a decrease in the value of your investment.
- This strategy may hold a limited number of investments. If one of these investments falls in value this can have a greater impact on the strategy’s value than if it held a larger number of investments.
- Smaller companies may be riskier and their shares may be less liquid than larger companies, meaning that their share price may be more volatile.
- Emerging markets or less developed countries may face more political, economic or structural challenges than developed countries. Accordingly, investment in emerging markets is generally characterised by higher levels of risk than investment in fully developed markets.
- The strategy may invest in derivatives index futures and FX forwards to obtain, increase or reduce exposure to underlying assets. The use of derivatives may result in greater fluctuations of returns due to the value of the derivative not moving in line with the underlying asset. Certain types of derivatives can be difficult to purchase or sell in certain market conditions.