
Content navigation
Key Takeaways
- UK equities have rallied strongly but still trade at a meaningful discount to global peers.
- Valuation gaps are most pronounced in small and mid caps, where fundamentals and M&A activity point to mispricing.
- Quality UK companies remain attractively valued despite strong long‑term outperformance.
2025 was an excellent year for UK equities as the FTSE All Share index returned 24%. This was driven by the largest UK listed companies and also resulted in the FTSE 100 index returning 26%. This momentum carried into the new year, as the FTSE 100 smashed through the 10,000 mark and continued its upwards march to its current all-time highs.
The exciting thing about the UK equity market is that despite recent strong performance, valuations remain compelling, especially when looking at global comparisons. We’ve also seen sharp divergences in returns across the market, creating opportunities for active managers who are positioned to take advantage of valuation disconnects, especially in mid caps and quality run companies.
Valuation Opportunity: UK Equities
The UK is far from alone in benefiting from a period of strong equity market returns. Globally, equities have performed well, especially US equities. Therefore, despite solid performance, the UK is currently trading at around a 30% discount to global peers1. We see the scale of this gap reflecting sentiment, over fundamentals, making the valuation opportunity in UK equities certainly look interesting.
The high levels of M&A activity also point towards the valuation opportunity, especially in mid cap equities which represented 70% of last year’s £35 billion of bids2. Corporate buyers and private equity investors are increasingly active in the UK market. Persistent valuation discounts have created a clear disconnect between share prices and underlying fundamentals, further highlighting the value available in the market.
Valuation Opportunity: Mid Cap UK Equities
We continue to see opportunities across the market cap spectrum but see the greatest value within the small and mid cap sector.
Exhibit 1: FTSE 250 relative to FTSE 100 12-month forward P/E premium/discount
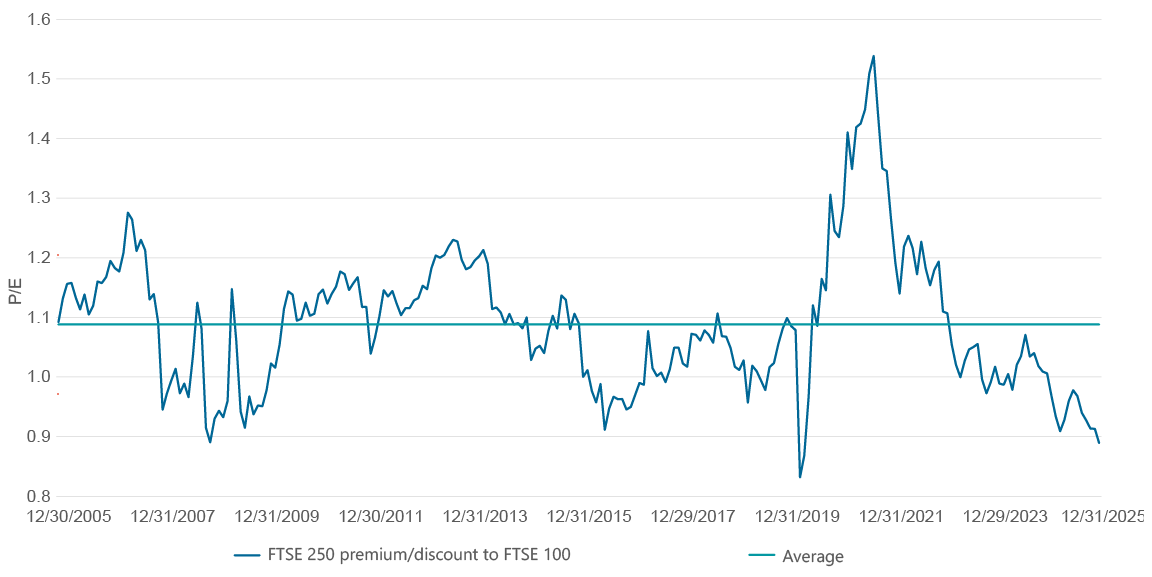
Source: Forward P/E: FactSet as at 31 December 2025. P/E = Price-to-earnings ratio.
As we enter 2026, we mark more than four years of underperformance of the mid cap asset class, relative to large cap. This surpasses the previous longest period of underperformance, which was from 1988-1992, a turbulent span marked by the UK’s brief Exchange Rate Mechanism membership, soaring inflation, interest rates peaking at 15% and a recession - a scenario very different from today. However, the broad trend since 1992 has been the long-term outperformance of mid caps. There have been only two notable exceptions: the aftermath of the dot.com bubble (2½ years) and the Global Financial Crisis (1¾ years). After these periods mid caps went on to produce multi-year outperformance. We believe the disconnect from long-term relative performance will correct itself with mid caps positioned to reassert their dominance.
Exhibit 2: FTSE 250 ex Investment Trusts Total Return Relative to FTSE 100
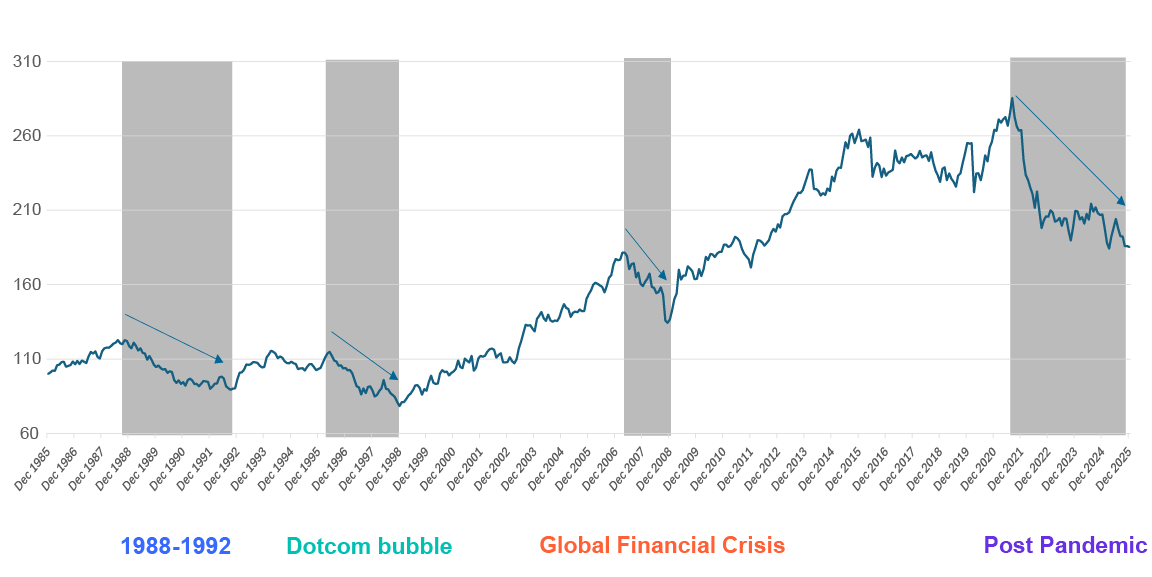
Source: © 2025 FTSE. All rights reserved. Total return in GBP since launch: 12 July 1999 to 31 December 2025. Performance details provided are in GBP, include the reinvested dividends, net of basic rate UK tax and management fees.
-
"After these periods mid caps went on to produce multi-year outperformance."
Valuation Opportunity: Quality UK Companies
We also see valuation opportunities in stocks with quality characteristics. By this we mean companies with strong balance sheets, dependable cash flows, competitive positioning, and management teams focused on long‑term value creation. Historically, investing in quality stocks has proven to create significant value for investors. However, in recent years, there has been an outsized performance of value stocks, at the expense of quality and growth. Given current valuations and improvements in underlying business fundamentals, we could see profound moves in quality names.
Exhibit 3: Quality Adds Value Over the Long Term
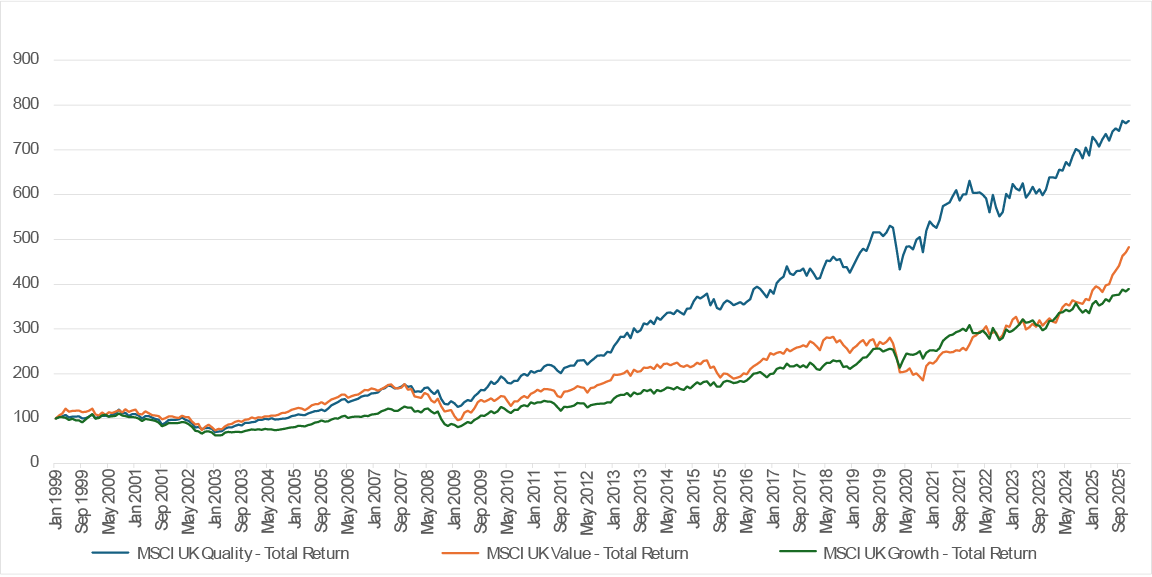
Source: FactSet as at 31 December 2025
Exhibit 4: Five years returns – Quality, Growth and Value
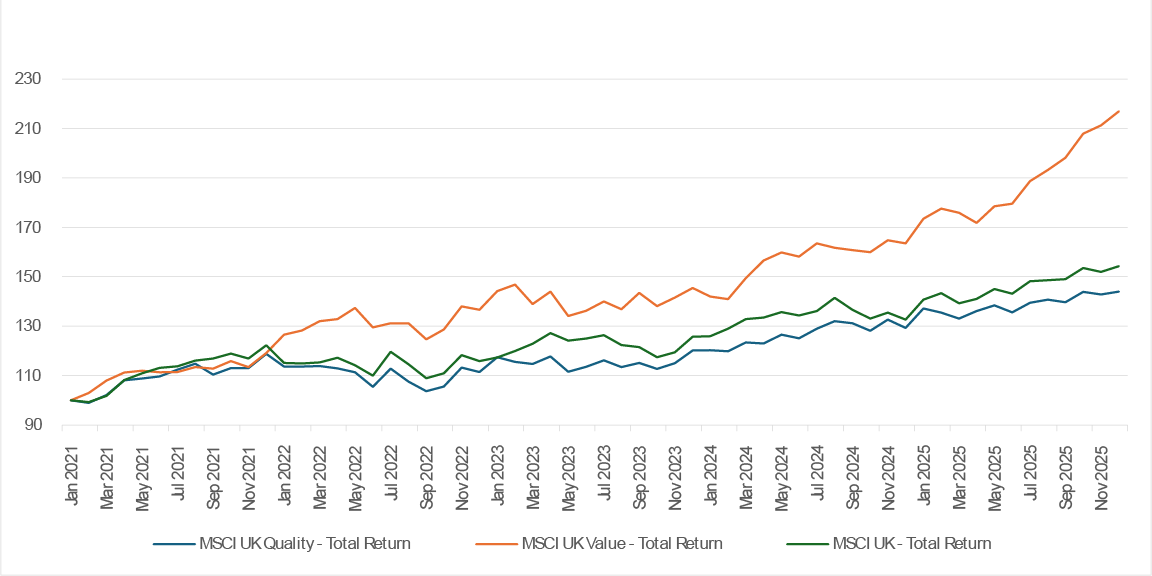
Source: FactSet as at 31 December 2025
UK equities have delivered strong returns over the last 14 months, yet valuations continue to point to opportunity rather than excess. The market still trades at a meaningful discount to global peers, despite improving macro conditions and rising acquisition activity. For investors willing to look beyond headlines, this disconnect between performance and price creates a compelling backdrop — particularly across under‑appreciated areas of the UK market — where we see a range of interesting investment opportunities.
Sources
1Bloomberg, 30 January 2025, based on price/earnings ratio comparing FTSE100 against the MSCI World Index
2Peel Hunt, 31 December 2025
Important Information
This information is issued and approved by ClearBridge Investment Management Limited (‘CIML’), authorised and regulated by the Financial Conduct Authority. It does not constitute investment advice. Market and currency movements may cause the capital value of shares, and the income from them, to fall as well as rise and you may get back less than you invested.
The information contained in this document has been compiled with considerable care to ensure its accuracy. However, no representation or warranty, express or implied, is made to its accuracy or completeness. ClearBridge Investments has procured any research or analysis contained in this document for its own use. It is provided to you only incidentally and any opinions expressed are subject to change without notice.
This document may not be distributed to third parties. It is confidential and intended only for the recipient. The recipient may not photocopy, transmit or otherwise share this document, or any part of it, with any other person without the express written permission of Martin Currie Investment Management Limited.
The document does not form the basis of, nor should it be relied upon in connection with, any subsequent contract or agreement. It does not constitute, and may not be used for the purpose of, an offer or invitation to subscribe for or otherwise acquire shares in any of the products mentioned.
Past performance is not a guide to future returns.
The distribution of specific products is restricted in certain jurisdictions, investors should be aware of these restrictions before requesting further specific information.
The views expressed are opinions of the portfolio managers as of the date of this document and are subject to change based on market and other conditions and may differ from other portfolio managers or of the firm as a whole. These opinions are not intended to be a forecast of future events, research, a guarantee of future results or investment advice.
Please note the information within this report has been produced internally using unaudited data and has not been independently verified. Whilst every effort has been made to ensure its accuracy, no guarantee can be given.
The information provided should not be considered a recommendation to purchase or sell any particular strategy / fund / security. It should not be assumed that any of the securities discussed here were or will prove to be profitable.
It is not known whether the stocks mentioned will feature in any future portfolios managed by ClearBridge Investments. Any stock examples will represent a small part of a portfolio and are used purely to demonstrate our investment style.
Risk warnings – Investors should also be aware of the following risk factors which may be applicable to the strategy shown in this document.
- Investing in foreign markets introduces a risk where adverse movements in currency exchange rates could result in a decrease in the value of your investment.
- This strategy may hold a limited number of investments. If one of these investments falls in value this can have a greater impact on the strategy’s value than if it held a larger number of investments.
- Smaller companies may be riskier and their shares may be less liquid than larger companies, meaning that their share price may be more volatile.