
Content navigation

Key Takeaways
- A global market: Large cap companies in the UK market provide broad international exposure, despite often being viewed as domestic businesses.
- Broad sources of return: The UK market offers exposure across geographies, sectors and investment styles. This stands in contrast to global equity portfolios, which have become increasingly concentrated in US mega cap tech stocks.
- Appealing valuation opportunity: UK equities are trading at around a 30% discount to global peers1, offering global exposure at appealing valuations.
We are at the tail end of a multi-decade trend where UK investors have searched for diversification through global equity allocations. Yet global indices have become increasingly concentrated in US equities over this time, in particular large technology companies. After years of reallocating away from the UK, it may be time to reassess the breadth of exposure and value available in the domestic market.
Exhibit 1: UK Global Weighting Has Steadily Declined
MSCI ACWI Regional Weights
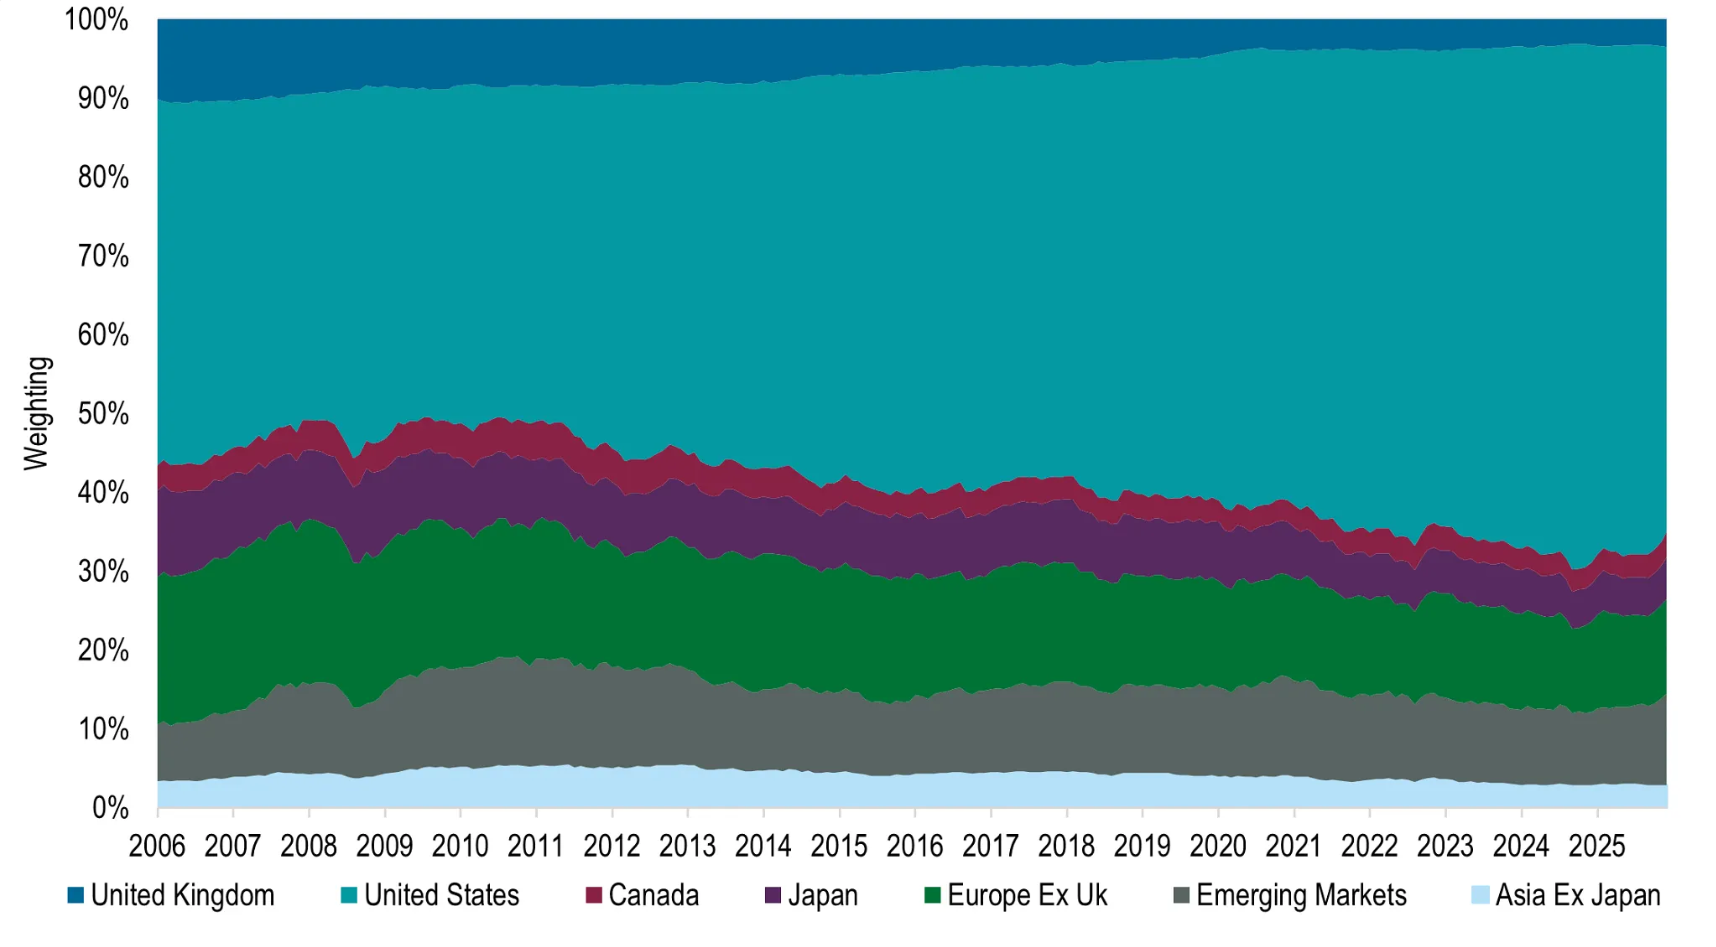
Source: FactSet as at 28 February 2026.
Global revenues
UK equities are often seen as a domestic allocation, but the reality is far more global. To put this into perspective, over 70% of FTSE 100 index revenues2 are earned overseas. These multinational businesses span sectors, with revenues and profit drivers shaped as much by global demand as by the UK economy.
Sector exposure
The UK market is often described as more “traditional”, reflecting its sizeable allocations to the cyclical financials and commodities sectors. Yet it also offers meaningful exposure to more defensive areas such as utilities, health care and consumer staples. This mix means returns can be driven by a broader set of factors and may help smooth performance across the economic cycle.
Exhibit 2: A Diversified Market
FTSE All Share Sector Weightings
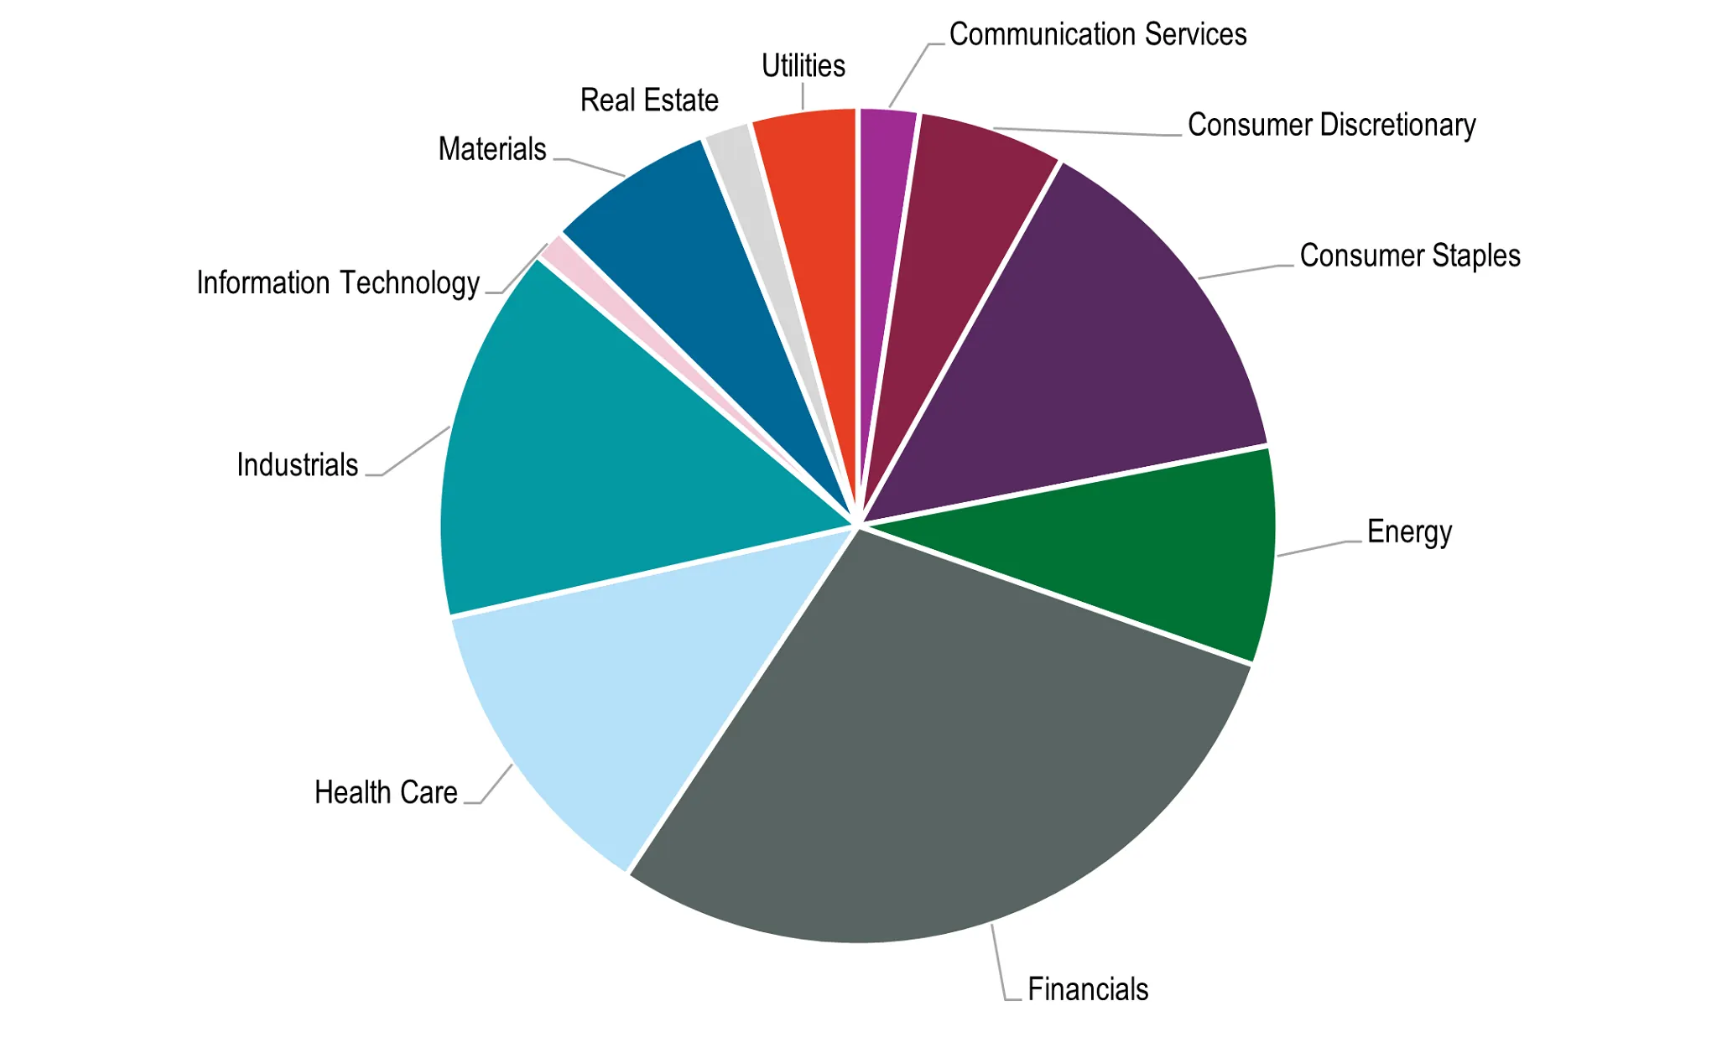
Source: FactSet as at 31 December 2025.
-
"UK equities offer a compelling combination of global revenue exposure, sector breadth and income generation."
Style exposure
The UK market has a strong dividend culture, with income forming a key component of UK equity investors’ total returns. As a result, it offers a wide range of income-oriented companies across most sectors, providing ample scope to construct UK income portfolios. In recent years, attractive dividend yields have also been complemented by a growing use of share buybacks, further supporting shareholder returns.
The UK also has a tilt towards value stocks and, when combined with its income orientation, a UK equity allocation can act as a useful style counterbalance to heavy growth allocations by introducing differentiated return drivers.
Valuations
UK equities trade at a sizeable discount to the MSCI World Index, even after accounting for differences in sector composition. In our view, this partly reflects persistent negative sentiment towards the domestic economy. However, current valuations appear to underappreciate the global nature of UK-listed companies' earnings. This creates an opportunity to access international growth through UK equities - at a discounted price.
Exhibit 3: Valuations Remain Historically Cheap
MSCI UK 12 Month Forward P/E relative to MSCI World
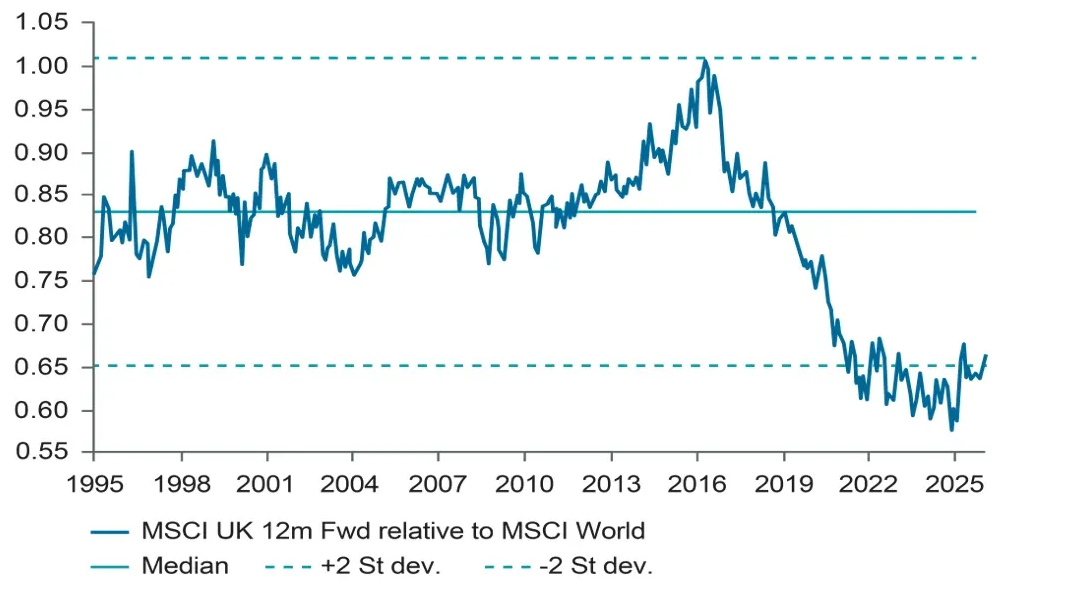
Source: JPM as at 31 December 2025. P/E = Price-to-earnings ratio.
Time to take another look
UK equities offer a compelling combination of global revenue exposure, sector breadth and income generation. Together, these characteristics can help balance portfolios that are increasingly concentrated elsewhere. And when you then consider its relatively attractive valuations, the UK is certainly a market worth revisiting.
Sources
1Source: Bloomberg as of 30 January 2026.
2Source: Morningstar as of 31 January 2026.
Important Information
This information is issued and approved by ClearBridge Investment Management Limited (‘CIML’), authorised and regulated by the Financial Conduct Authority. It does not constitute investment advice. Market and currency movements may cause the capital value of shares, and the income from them, to fall as well as rise and you may get back less than you invested.
The information contained in this document has been compiled with considerable care to ensure its accuracy. However, no representation or warranty, express or implied, is made to its accuracy or completeness. ClearBridge Investments has procured any research or analysis contained in this document for its own use. It is provided to you only incidentally and any opinions expressed are subject to change without notice.
This document may not be distributed to third parties. It is confidential and intended only for the recipient. The recipient may not photocopy, transmit or otherwise share this document, or any part of it, with any other person without the express written permission of Martin Currie Investment Management Limited.
The document does not form the basis of, nor should it be relied upon in connection with, any subsequent contract or agreement. It does not constitute, and may not be used for the purpose of, an offer or invitation to subscribe for or otherwise acquire shares in any of the products mentioned.
Past performance is not a guide to future returns.
The distribution of specific products is restricted in certain jurisdictions, investors should be aware of these restrictions before requesting further specific information.
The views expressed are opinions of the portfolio managers as of the date of this document and are subject to change based on market and other conditions and may differ from other portfolio managers or of the firm as a whole. These opinions are not intended to be a forecast of future events, research, a guarantee of future results or investment advice.
Please note the information within this report has been produced internally using unaudited data and has not been independently verified. Whilst every effort has been made to ensure its accuracy, no guarantee can be given.
The information provided should not be considered a recommendation to purchase or sell any particular strategy / fund / security. It should not be assumed that any of the securities discussed here were or will prove to be profitable.
It is not known whether the stocks mentioned will feature in any future portfolios managed by ClearBridge Investments. Any stock examples will represent a small part of a portfolio and are used purely to demonstrate our investment style.
Risk warnings – Investors should also be aware of the following risk factors which may be applicable to the strategy shown in this document.
- Investing in foreign markets introduces a risk where adverse movements in currency exchange rates could result in a decrease in the value of your investment.
- This strategy may hold a limited number of investments. If one of these investments falls in value this can have a greater impact on the strategy’s value than if it held a larger number of investments.
- Smaller companies may be riskier and their shares may be less liquid than larger companies, meaning that their share price may be more volatile.